Differential Coverage for Debugging
Russ Cox
April 25, 2025
research.swtch.com/diffcover
Posted on Friday, April 25, 2025.
April 25, 2025
research.swtch.com/diffcover
I have been debugging some code I did not write and was reminded of this technique. I’m sure it’s a very old debugging technique (like bisection), but it should be more widely known. Suppose you have one test case that’s failing. You can get a sense of what code might be involved by comparing the code coverage of successful tests with the code coverage of the failing test.
For example, I’ve inserted a bug into my development copy of math/big:
$ go test
--- FAIL: TestAddSub (0.00s)
    int_test.go:2020: addSub(-0xffffffffffffffffffffffffffffffffffffffffffffffffffffffffffffffff, 0xffffffffffffffffffffffffffffffffffffffffffffffffffffffffffffffff) = -0x0, -0x1fffffffffffffffffffffffffffffffffffffffffffffffffffffffffffffffe, want 0x0, -0x1fffffffffffffffffffffffffffffffffffffffffffffffffffffffffffffffe
FAIL
exit status 1
FAIL	math/big	7.528s
$
Let’s collect a passing and failing profile:
$ go test -coverprofile=c1.prof -skip='TestAddSub$'
PASS
coverage: 85.0% of statements
ok  	math/big	8.373s
% go test -coverprofile=c2.prof -run='TestAddSub$'
--- FAIL: TestAddSub (0.00s)
    int_test.go:2020: addSub(-0xffffffffffffffffffffffffffffffffffffffffffffffffffffffffffffffff, 0xffffffffffffffffffffffffffffffffffffffffffffffffffffffffffffffff) = -0x0, -0x1fffffffffffffffffffffffffffffffffffffffffffffffffffffffffffffffe, want 0x0, -0x1fffffffffffffffffffffffffffffffffffffffffffffffffffffffffffffffe
FAIL
coverage: 4.7% of statements
exit status 1
FAIL	math/big	0.789s
$
Now we can diff them to make a profile showing what’s unique about the failing test:
$ (head -1 c1.prof; diff c[12].prof | sed -n 's/^> //p') >c3.prof
$ go tool cover -html=c3.prof
The head -1 is preserving the one-line coverage profile header. The diff | sed saves only the lines unique to the failing test’s profile, and the go tool cover -html opens the profile in a web browser.
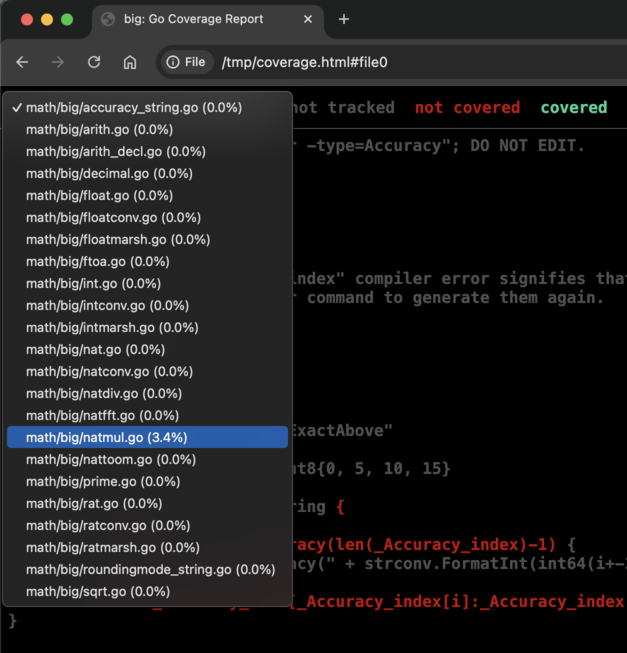
In the resulting profile, “covered” (green) means it ran in the failing test but not the passing ones, making it something to take a closer look at.
Looking at the file list, only natmul.go has a non-zero coverage percentage, meaning it contains lines that are unique to the failing test.
If we open natmul.go, we can see various lines in red (“uncovered”).
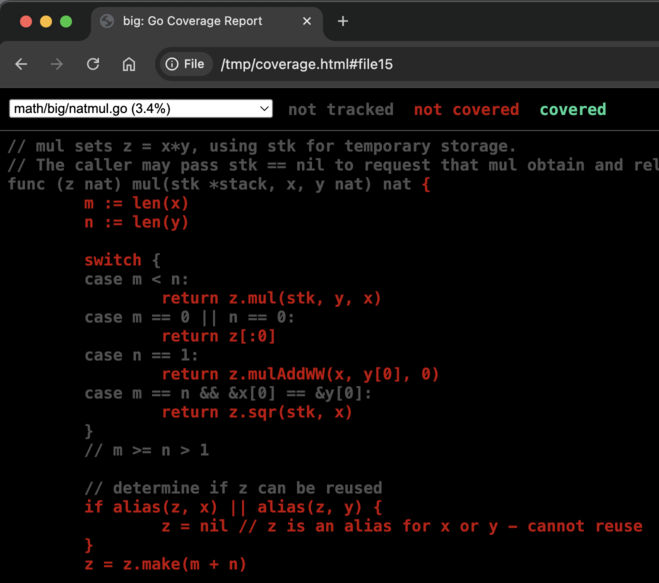
These lines ran in passing tests but not in the failing test. They are exonerated, although the fact that the lines normally run but were skipped in the failing test may prompt useful questions about what logic led to them being skipped. In this case, it’s just that the test does not exercise them: the nat.mul method has not been called at all.
Scrolling down, we find the one section of green.
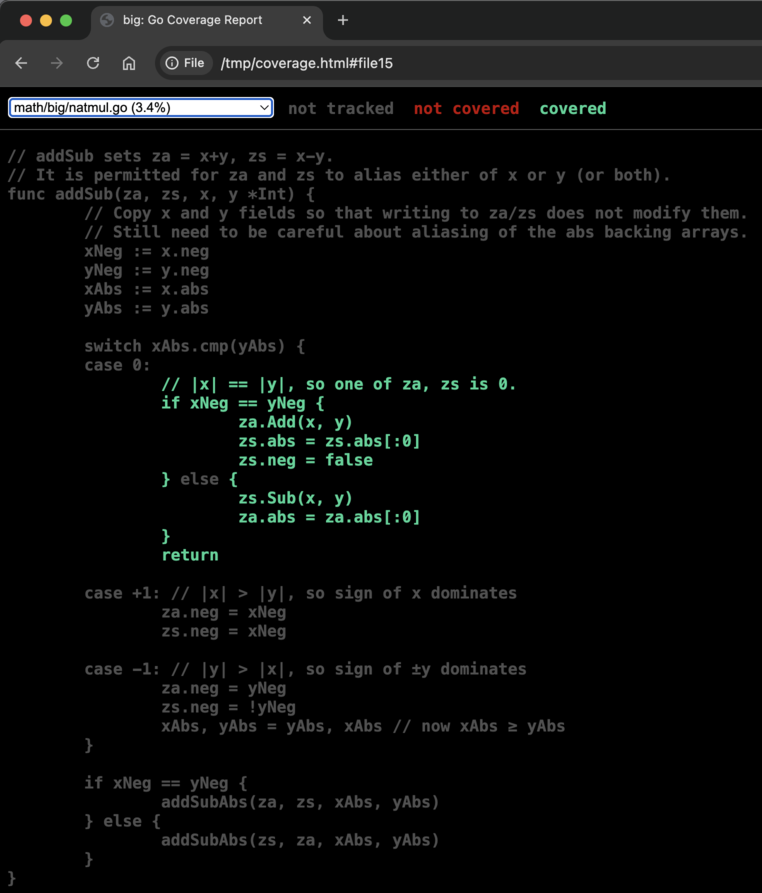
This code is where I inserted the bug: the else branch is missing za.neg = false, producing the -0x0 in the test failure.
Differential coverage is cheap to compute and display, and when it’s right, it can save a lot of time.
Out of over 15,000 lines of code, differential coverage identified 10, including the two relevant ones.
Of course, this technique is not foolproof: a passing test can still execute buggy code if the bug is data-dependent, or if the test is not sensitive to the specific mistake in the code. But a lot of the time, buggy code only triggers failures. In those cases, differential coverage pinpoints the code blocks that merit a closer look.
You can see the full profile here.
A simpler but still useful technique is to view the basic coverage profile for a single failing test. That gives you an accurate picture of which sections of code ran in the test, which can guide your debugging: code that didn’t run is not the problem. And if you are confused about how exactly a particular function returned an error, the coverage pinpoints the exact error line. In the example above, the failing test covered only 4.7% of the code.
Differential coverage also works for passing tests. Want to find the code that implements the SOCK5 proxy in net/http?
$ go test -short -skip=SOCKS5 -coverprofile=c1.prof net/http
$ go test -short -run=SOCKS5 -coverprofile=c2.prof net/http
$ (head -1 c1.prof; diff c[12].prof | sed -n 's/^> //p') >c3.prof
$ go tool cover -html=c3.prof
Have fun!